Aortic valve area (AVA), pre-ViV
Continuous, and data-driven tertile split (no fixed clinical cutoff applied).
Raw values by outcome
| Died | N=81, mean=0.87 cm2, median=0.80 cm2 |
| Alive | N=144, mean=0.98 cm2, median=0.80 cm2 |
Comparisons
| Comparison | N | Events | β (SE) | Cox HR (95% CI) | Cox p | Log-rank p | Result |
|---|---|---|---|---|---|---|---|
| Continuous, per 0.1 cm2 | 225 | 81 | -0.081 (0.040) | 0.92 (0.85–1.00) | 0.0406 | – | Significant |
| Continuous, per 0.2 cm2 | 225 | 81 | -0.163 (0.080) | 0.85 (0.73–0.99) | 0.0406 | – | Significant |
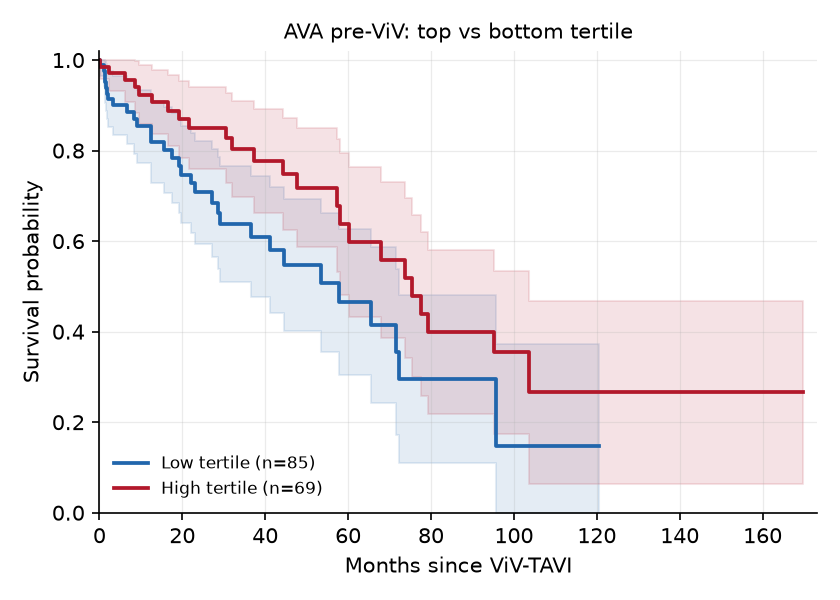
| Top vs bottom tertile (data-driven cutoff) | 154 | 55 | -0.589 (0.279) | 0.55 (0.32–0.96) | 0.0347 | 0.0325 | Significant |
Tertile cuts: ≤0.70 cm2 vs >0.90 cm2.
Kaplan–Meier curve
Interactive: select covariates
Every change is sent to the backend, which reruns the Cox model on the full dataset and returns the result (POST /api/multivariate). Listwise deletion: only patients with data for every selected covariate are included.
Interactive result
N=–, events=–