Tricuspid regurgitation (TR) grade, pre-ViV
Ordinal, any vs none, moderate-severe combined, severe alone.
Grade distribution
| Grade | N | Deaths | Raw mortality | Median follow-up |
|---|---|---|---|---|
| None (0) | 62 | 17 | 27.4% | 25.5 mo |
| Mild (1) | 123 | 48 | 39.0% | 24.5 mo |
| Moderate (2) | 36 | 15 | 41.7% | 22.2 mo |
| Severe (3) | 10 | 3 | 30.0% | 16.1 mo |
Comparisons
| Comparison | N | Events | β (SE) | Cox HR (95% CI) | Cox p | Log-rank p | Result |
|---|---|---|---|---|---|---|---|
| Ordinal, continuous (per grade, 0-3) | 231 | 83 | 0.317 (0.154) | 1.37 (1.02–1.86) | 0.0397 | – | Significant |
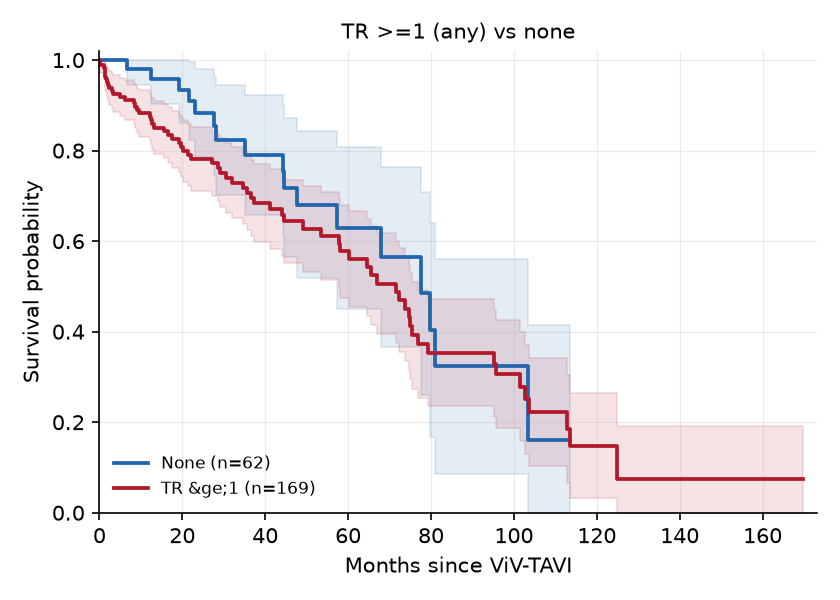
| TR ≥1 (any) vs none | 231 | 83 | 0.321 (0.273) | 1.38 (0.81–2.35) | 0.2397 | 0.2377 | Not significant |
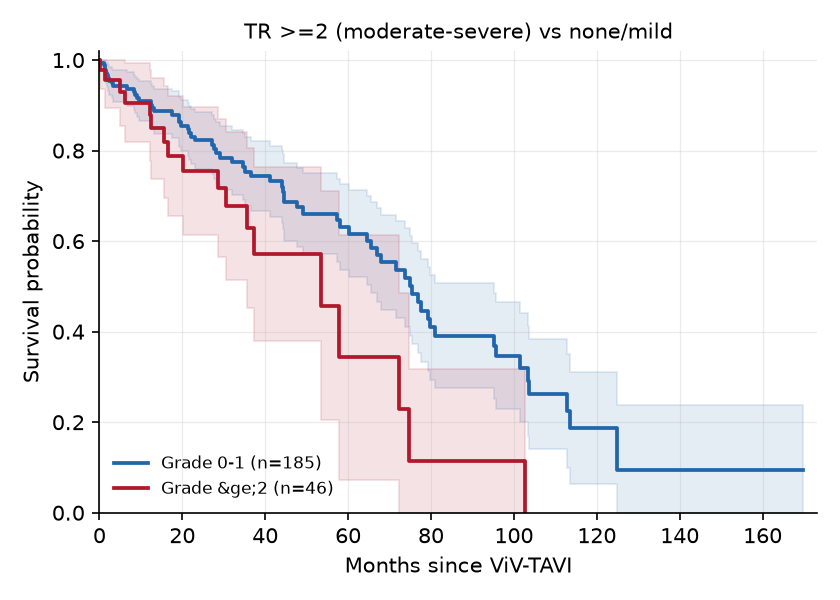
| TR ≥2 (moderate-severe) vs none/mild | 231 | 83 | 0.613 (0.275) | 1.85 (1.08–3.16) | 0.0258 | 0.0237 | Significant |
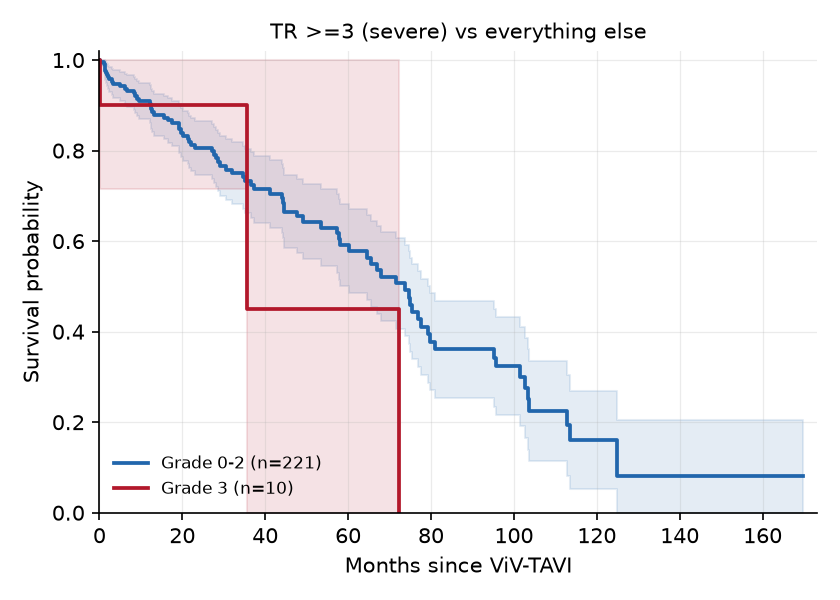
| TR ≥3 (severe) vs everything else | 231 | 83 | 0.433 (0.592) | 1.54 (0.48–4.92) | 0.4651 | 0.4616 | Not significant |
Kaplan–Meier curves
TR ≥1 (any) vs none
TR ≥2 (moderate-severe) vs none/mild
TR ≥3 (severe) vs everything else
Interactive: select covariates
Every change is sent to the backend, which reruns the Cox model on the full dataset and returns the result (POST /api/multivariate). Listwise deletion: only patients with data for every selected covariate are included.
Interactive result
N=–, events=–